In today’s quick Data visualization tutorial, we will show you how you can easily draw horizontal lines in Python plots that run in parallel to the X axis. We’ll use a bar plot as an example, but you can obviously apply the same logic for other charts such as scatter, histogram, lien plots etc’. Once we render the line over our chart, we’ll demonstrate some simple customization options.
Preparation
We’ll start by defining some dummy data for our chart by leveraging the numpy library.
import numpy as np
import matplotlib.pyplot as plt

np.random.seed(10)

x = ['Sunday', 'Monday', 'Tuesday', 'Wednesday', 'Thursday']
y = np.random.randint(75,100,5)
Python horizontal line plotting using Matplotlib
We’ll first use Matplotlib to render our plot:
fig, ax= plt.subplots(figsize=(9,5))
ax.bar(x, height=y);

# Now we'll use the plt.axhline method to render the horizontal line at y=81

fig, ax= plt.subplots(figsize=(9,5))

ax.bar(x, height=y);
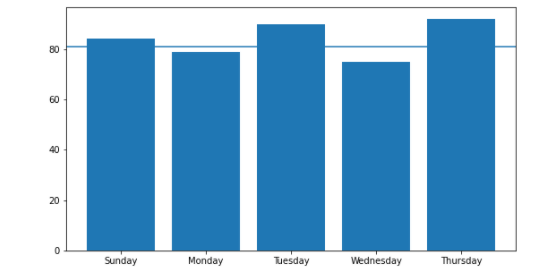
ax.axhline(y=81);
Here’s the result:

Customizing the Matplotlib axhline example
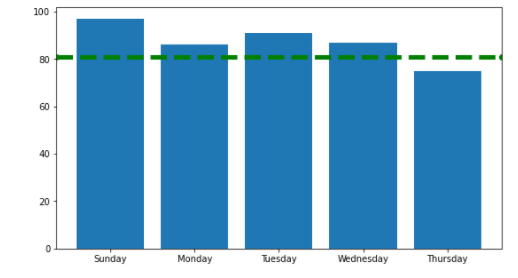
We’ll customize the line style by defining custom color, marker style, line style and width as shown below:
fig, ax= plt.subplots(figsize=(9,5))

ax.bar(x, height=y);
ax.axhline(y=81, color='green', marker='o', linestyle='--', linewidth = 5);
Plotting multiple lines
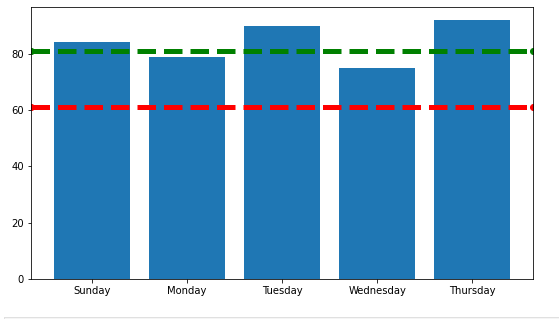
To add multiple lines to the chart, we’ll simply invoke axhline as needed.
fig, ax= plt.subplots(figsize=(9,5))

ax.bar(x, height=y);
ax.axhline(y=81, color='green', marker='o', linestyle='--', linewidth = 5);
ax.axhline(y=61, color='red', marker='o', linestyle='--', linewidth = 5);
Here’s our chart:

Drawing grid lines
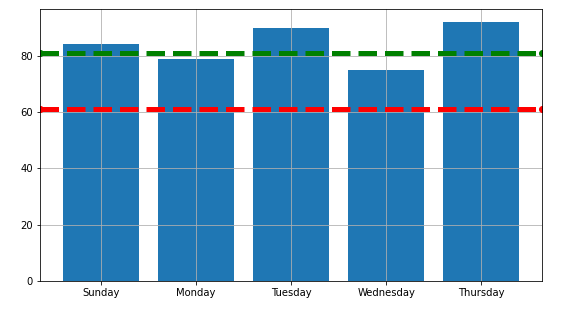
If we want to easily draw gridlines in the background of our chart we can call plt.grid method
ax.grid()And here’s our chart

Note: if you prefer the grid line to be displayed behind the chart, just use the zorder parameter.
Here’s the example:
fig, ax= plt.subplots(figsize=(9,5))

ax.bar(x, height=y, zorder=10);
ax.grid(zorder=0)
Vertical lines plotting will be covered in our next tutorial.