In today’s quick recipe, we’ll learn the basic of Matplotlib title customization. We’ll use bar plots, but the post is fully relevant for other Matplotlib charts: line, scatter, distribution and bar plots.
Step 1: Prepare your data for visualization
We’ll start by defining a simple dataset for this example.
# Python3

# import pandas and matplotlib
import pandas as pd
import matplotlib.pyplot as plt

# Create Dataframe dataframe
revenue = pd.DataFrame({"city":['Chicago', 'Boca Raton', 'Miami','Omaha']* 2,
                    "sales": [3568, 2367, 2152, 3027, 3695, 2495, 4134, 2162]})

# Grouping the data
rev_by_city = revenue.groupby('city')['sales'].sum()
We got a Pandas Series that we’ll quickly visualize using Pandas & Matplotlib
Step 2: Draw your Matplotlib plot
Let’s set a very simple plot using Matplotlib:
x = rev_by_city.index
y = rev_by_city.values

fig, ax = plt.subplots(dpi = 147)
ax.bar(x,y, color='green');
We got a very simple chart.
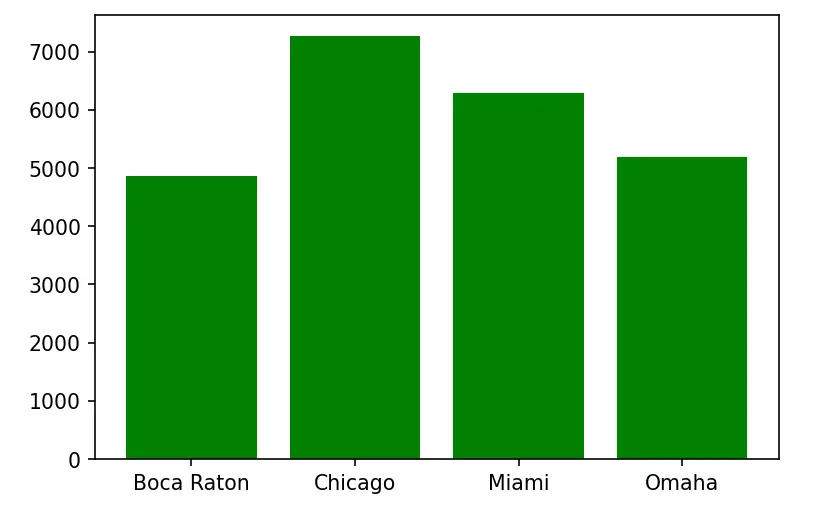
Note: We could have got a somewhat similar output using the Pandas library only:
rev_by_city.plot(kind='bar', color='green');Step 3: Matplotlib chart custom titles
Let’s run the get_title() method on our plot:
ax.get_title()As expected, the result is an empty string.
Define plot titles
The plt.set_title() method is self explanatory. It allows to define a title for your chart.
ax.set_title('Sales by City');
fig
Customize Matplotlib title fonts size and color
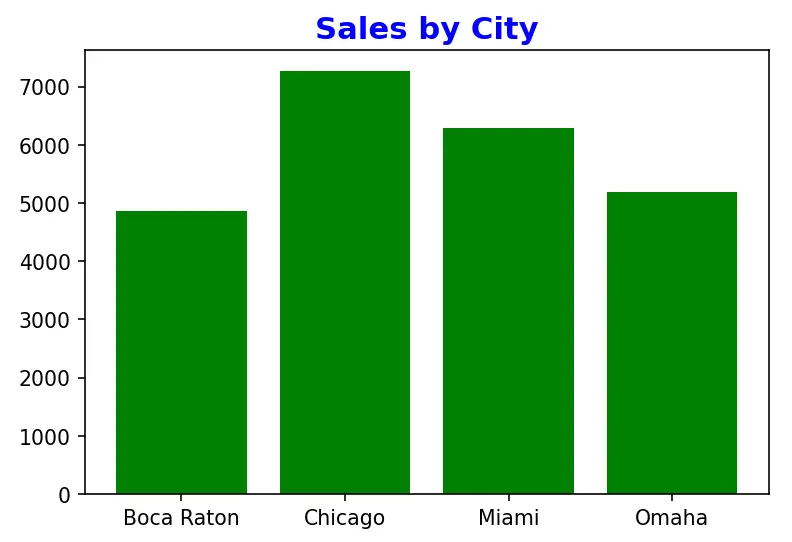
Let’s quickly define a title and customize the font size, weight and color.
ax.set_title('Sales by City', fontsize=15, color= 'blue', fontweight='bold');
fig
Here’s the result:
Set Matplotlib title position
By default the title is aligned to the center of the plot. Using the loc parameter, you are able to left and right align it.
In this case, we’ll left align the title:
fig, ax = plt.subplots(dpi = 147)
ax.bar(x,y, color='green');
ax.set_title('Sales by City', fontsize=15, color= 'blue', fontweight='bold',loc='left');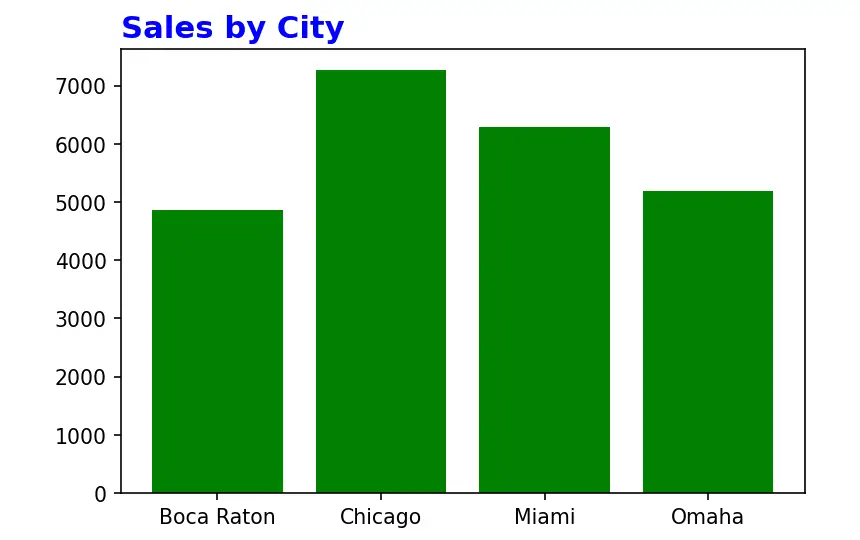
We can also use the y parameter to determine the margin from the title to the chart
fig, ax = plt.subplots(dpi = 147)
ax.bar(x,y, color='green');
ax.set_title('Sales by City', fontsize=15, color= 'blue', fontweight='bold', y= 1.1);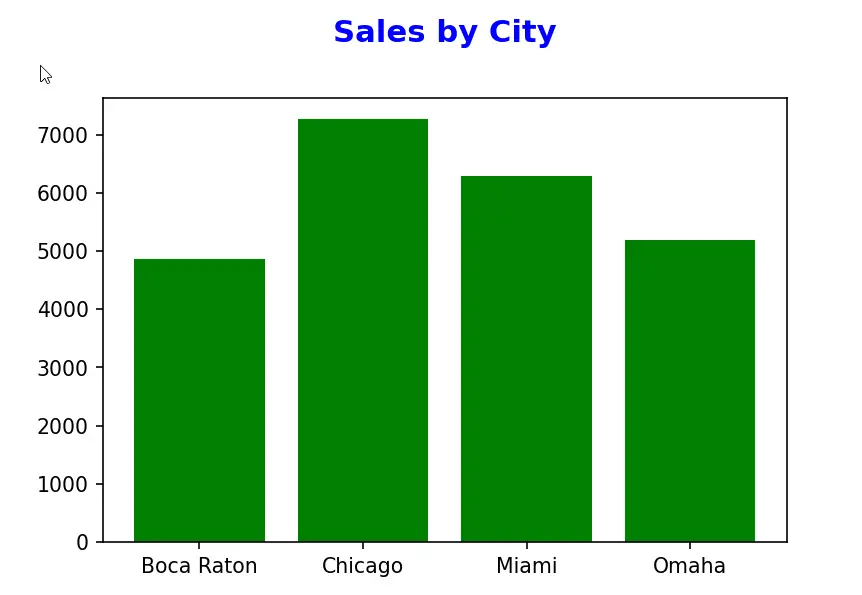
Matplotlib title inside plot
What if we want to place the title so it will overlap with the inside part of the plot figure? That’s possible by setting the y parameter to a negative figure, in our case -0.9. We also used the pad parameter to increase the padding from the figure border:
fig, ax = plt.subplots(dpi = 147)
ax.bar(x,y, color='green');
ax.set_title('Sales by City', fontsize=15, color= 'blue', fontweight='bold', loc='left', y=0.9,  pad= -10);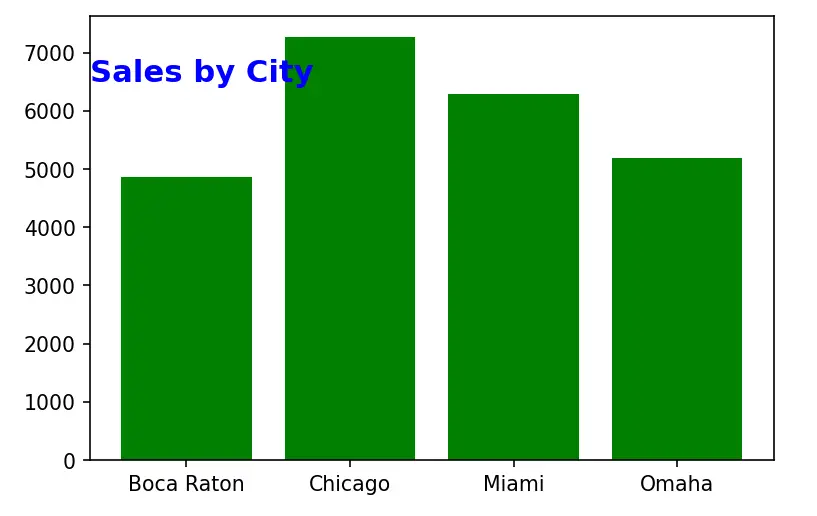
If you are using Seaborn, you might want to look into a similar tutorial on how to customize Seaborn titles.