Quite often as part of your data wrangling, you’ll invariably need to subset or filter your dataset and select for specific rows by one or multiple values. In today’s quick tutorial i’ll show how to do exactly that.
Creating your data
We’ll start by creating a very simple data set which we’ll use for learning purposes. As we typically do, we’ll first go ahead and import the Pandas library to our work environment and then create a dataframe from a dictionary as shown below.
# import Python Pandas
import pandas as pd

# Now, let's create the dataframe
df = pd.DataFrame({"Year": [ 2018, 2019, 2020] ,
                     "Person": ["John", "Kim", "Bob"],
                     "Budget": [20000, 30000, 40000]})
'Show the dataframe header
df.head()| Year | Person | Budget | |
|---|---|---|---|
| 0 | 2018 | John | 20000 |
| 1 | 2019 | Kim | 30000 |
| 2 | 2020 | Bob | 40000 |
Find df entries by single value
Let’s assume that we would like to show all entries with budget greater than 30K. We’ll first go ahead and define a variable containing the filtering criteria. Then we’ll apply it on the dataframe and pull the selected records
# single condition
mask = df["Budget"]> 30000
df[mask]
Here’s the result:
| Year | Person | Budget | |
|---|---|---|---|
| 2 | 2020 | Bob | 40000 |
Select rows by multiple conditions
Next we’ll run through a bit more complex example that has a complex logical select criteria.
# Complex select criteria with boolean AND (&)
mask = (df["Budget"]>= 30000) & (df["Year"] == 2020)
df[mask]| Year | Person | Budget | |
|---|---|---|---|
| 1 | 2019 | Kim | 30000 |
We can also use boolean OR as well.
# Using logical boolean OR
df[(df["Budget"]>= 30000) | (df["Year"] == 2020)]
The result will be:
| Year | Person | Budget | |
|---|---|---|---|
| 1 | 2019 | Kim | 30000 |
| 2 | 2020 | Bob | 40000 |
Subset with label (Loc)
Here’s a good example on filtering with boolean conditions with loc.
Find rows by index
You can also select specific rows or values in your dataframe by index as shown below. As a simple example, the code below will subset the first two rows according to row index.
df.iloc[[0,1],:]The following subset will be returned
| Year | Person | Budget | |
|---|---|---|---|
| 0 | 2018 | John | 20000 |
| 1 | 2019 | Kim | 30000 |
Bonus: Create a quick bar plot of your data
Besides its very powerful data manipulation capabilities, Pandas has built in data visualization capabilities based on other Python library named MatplotLib. Here’s a simple bar chart that you can create with one line of code, the parameters are pretty much self explanatory.
df.plot(x="Year", y="Budget", kind="bar", title="Budget by year");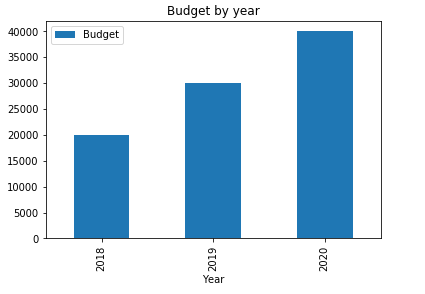
Frequently Asked Questions
How do I filter a Pandas dataframe to find rows matching multiple conditions?
Combine boolean conditions using the & (and) and | (or) operators, wrapping each condition in parentheses. For example, df[(df['age'] > 30) & (df['city'] == 'Boston')] returns only rows where both criteria are met. You can chain as many conditions as needed this way. The .loc[] accessor works well here too, since it accepts boolean arrays and lets you select specific columns in the same operation. Once you have filtered your subset, you may want to drop unnecessary columns from your filtered dataframe to keep only the fields relevant to your analysis.
What is the difference between loc, iloc, and conditional filtering?
The .loc[] accessor selects rows and columns by label, so you reference actual index values and column names. The .iloc[] accessor selects by integer position, treating the dataframe like a zero-indexed array. Conditional filtering uses boolean masks applied directly to the dataframe, such as df[df['score'] >= 90], and is the most common approach for value-based lookups. A practical workflow involves filtering rows by condition, then using groupby to count unique values across the resulting subset to summarize your findings quickly.
Can I find the first row that matches a specific value without scanning the entire dataframe?
Use df[df['column'] == value].head(1) or df.loc[df['column'] == value].iloc[0] to retrieve the first matching row. For large dataframes, .idxmax() or .idxmin() can locate the index of extreme values efficiently without a full boolean scan. Another approach is df.query("column == @value"), which can be more readable when working with complex expressions and variable references.