In this quick recipe we’ll learn how to quickly create a chart that displays time series key performance indicator data.
Let’s quickly start by creating some random data for this exercise:
import pandas as pd
import numpy as np # used for generating random data
np.random.seed(10)

date_range =  pd.date_range('2020-01-01','2020-11-01', freq ='MS')

raw_data = {'time': date_range, \
                     'sales': [x for x in np.random.randint(30, 100, \
                               len(date_range) )]}

# create dataframe from dictionary

sales = pd.DataFrame.from_dict(raw_data)

sales.head()
Here’s our dataframe header:
| time | sales | |
|---|---|---|
| 0 | 2020-01-01 | 79 |
| 1 | 2020-02-01 | 91 |
| 2 | 2020-03-01 | 87 |
| 3 | 2020-04-01 | 74 |
| 4 | 2020-05-01 | 66 |
Using DataFrame.plot() to draw datetime charts in Pandas
Now that we have some data available, let’s take a look at how to quickly draw our plot using the DataFrame.plot() method that is readily made available in Pandas.
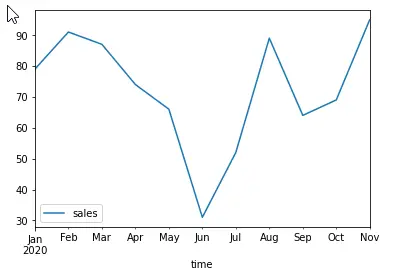
sales.plot(x= 'time', y= 'sales', kind='line');This will render a simple line plot. Pandas took care of converting the datetime values of the ‘time’ column to months automatically.

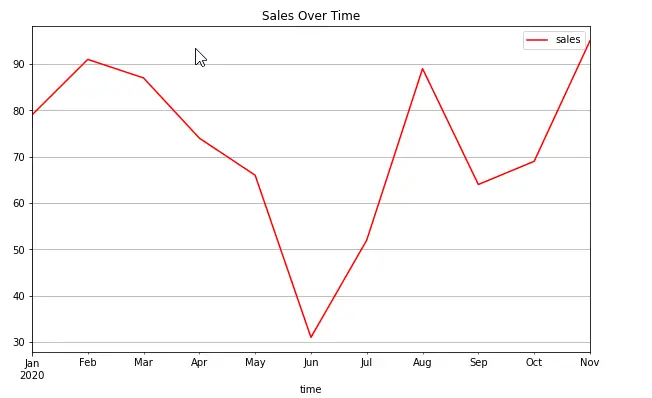
And a bit more elaborated version:
sales.plot(x= 'time',
           y= 'sales',
           kind='line',
           figsize = (10,6),
           title="Sales Over Time",
           grid=True ,
           style = 'r');