In this data visualization recipe we’ll learn how to visualize grouped data using the Pandas library as part of your Data wrangling workflow.
Data acquisition
We’ll start by creating representative data. Copy the code below and paste it into your notebook:
# Python3
# Import Pandas
import pandas as pd

# Create Dataframe
budget = pd.DataFrame({"quarter": [1, 3, 2, 4, 1, 4, 2, 2],
                       "area":['North', 'South', 'West','Midwest']* 2,
                     "target": [6734, 7265, 1466, 5426, 6578, 9322, 2685, 1769]})
budget.head()
Here’s our DataFrame header:
| quarter | area | target | |
|---|---|---|---|
| 0 | 1 | North | 6734 |
| 1 | 3 | South | 7265 |
| 2 | 2 | West | 1466 |
| 3 | 4 | Midwest | 5426 |
| 4 | 1 | North | 6578 |
Plot groupby in Pandas
Let’s first go ahead a group the data by area
sales_by_area = budget.groupby('area').agg(sales_target =('target','sum'))Here’s the resulting new DataFrame:
sales_by_areasales_target | |
|---|---|
| area | |
| Midwest | 7195 |
| North | 13312 |
| South | 16587 |
| West | 4151 |
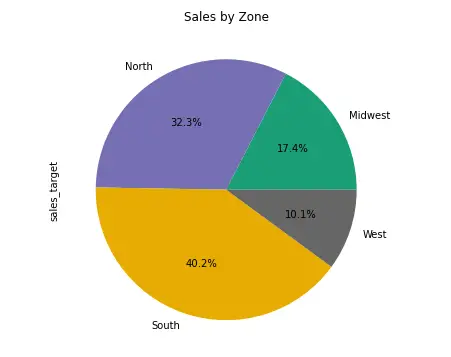
Groupby pie chart
We’ll use the DataFrame plot method and puss the relevant parameters. Note the usage of the optional title , cmap (colormap), figsize and autopct parameters.
- title assigns a title to the chart
- cmap assigns a color scheme map.
- figsize: determines the width and height of the plot.
- autopct helps us to format the values as floating numbers representing the percentage of the total.
sales_by_area.plot(kind='pie', x='area', y='sales_target', title = 'Sales by Zone',
cmap='Dark2', autopct="%.1f%%", figsize = (10,6), legend=False);
Here’s the resulting plot:

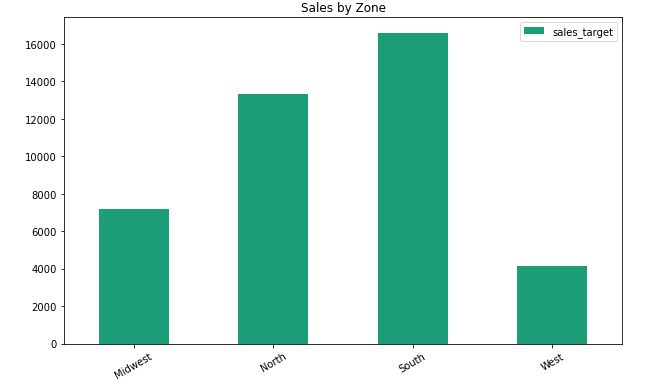
Groupby barplot
A similar example, this time using the barplot. Here’s the code that we’ll be using.
sales_by_area.plot(kind='bar', title = 'Sales by Zone', figsize = (10,6), cmap='Dark2', rot = 30);Note the legend that is added by default to the chart. Also worth noting is the usage of the optional rot parameter, that allows to conveniently rotate the tick labels by a certain degree. In our case – 30.
Here’s the resulting chart:

Groupby Histogram
We are able to quickly plot an histagram in Pandas. Note the usage of kind=’hist’ as a parameter into the plot method:
sales_by_area.plot(kind='hist', title = 'Sales by Zone', figsize = (10,6), cmap='Dark2', rot = 30);