In this tutorial we’ll learn about how to set and change legends in Python Seaborn charts. We’ll go through an end to end example which you might want to follow.
We’ll be using our deliveries dataset, which you can download from here.
Seaborn legends example
Consider the following script that renders a scatter plot from a Python DataFrame data.
# import required libraries
import seaborn as sns
import pandas as pd

sns.set_style('whitegrid')

# acquire the test data
deliveries = pd.read_csv('../data/del_tips.csv')

# define the axes content
x = deliveries['time_to_deliver']
y = deliveries['del_tip_amount']

#sns.scatterplot from DataFrame
fig, scatter = plt.subplots(figsize = (10,6), dpi = 100)
scatter = sns.scatterplot(x = x, y =y, data=deliveries, hue='type' )
scatter.set_title('Tip vs Delivery Speed', fontsize = 23, y =1.05);
We’ll get the following chart:

Hide the Seaborn legend
If you might want to remove your legend altogether, you need to use the legend=False switch.
scatter = sns.scatterplot(x = x, y =y, data=deliveries, hue='type', legend= False)Seaborn will display the following warning: No handles with labels found to put in legend.
Change Seaborn legend location
Probably the most visible issue we have with our chart is the location of the legend. What if we want to display it outside the figure, so it doesn’t overlap with any observation we plot?
The bbox_to_anchor parameter allows us to pass an (x,y) tuple with the required offset. You might want to tweak it as per your needs.
scatter.legend(bbox_to_anchor= (1.03, 1) );Note: We can also use the loc parameter to specify a location for the legend size on the the chart. I typically use loc= ‘upper right’.
Set legend font size
The second issue we recognize in our chart is that by default our legend fonts are too small for the figsize we set. We can fix it with ease:
#tweak the font heights in px
scatter.legend(fontsize = 15)
Modify the Seaborn legend title
Next we would like to provide a meaningful title to our legend.
scatter.legend(title="Delivery Type");Set the Legend background color
We can also modify the background color of our legend, as shown below:
scatter.legend(shadow = True, facecolor = 'grey')Bringing all of it together
scatter.legend(fontsize = 15, \
               bbox_to_anchor= (1.03, 1), \
               title="Delivery Type", \
               title_fontsize = 18, \
               shadow = True, \
               facecolor = 'white');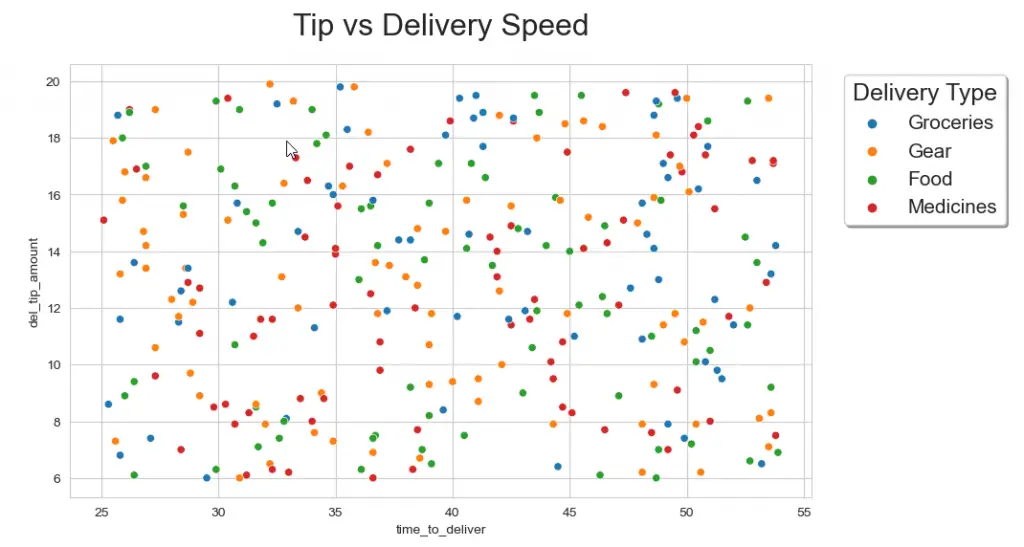
Notes:
- There is more to customize for Seaborn legends (handlers, labels etc’). We’ll cover that in subsequent tutorials.
- Although written for the scatterplot, this tutorial is applicable for the different Seaborn charts for raw data, bi-variate / categorical analysis: catplot, plotbox, barplot, paiplots etc’.