In this short recipe we’ll learn how to correctly set the size of a Seaborn chart in Jupyter notebooks/Lab.
Well first go a head and load a csv file into a Pandas DataFrame and then explain how to resize it so it fits your screen for clarity and readability.
Use plt figsize to resize your Seaborn chart
We’ll first go ahead and import data into our Dataframe
#Python3
import seaborn as sns
import pandas as pd
import matplotlib.pyplot as plt
sns.set_style('whitegrid')

#load the data into Pandas
deliveries = pd.read_csv('../../data/del_tips.csv')
Now let’s go ahead and create a simple scatter chart
scatter = sns.scatterplot(x = 'time_to_deliver', y ='del_tip_amount', data=deliveries, hue='type')
scatter.set_xlabel('Delivery Time (min)');
scatter.set_ylabel ('Tip Amount ($)');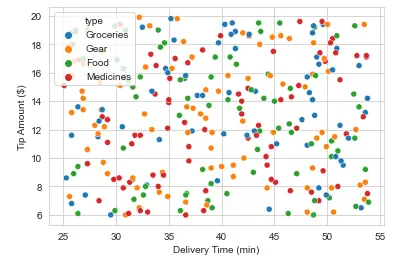
How to make our Seaborn chart bigger?
Our chart is pretty small and not fully legible, hence it needs to be resized.
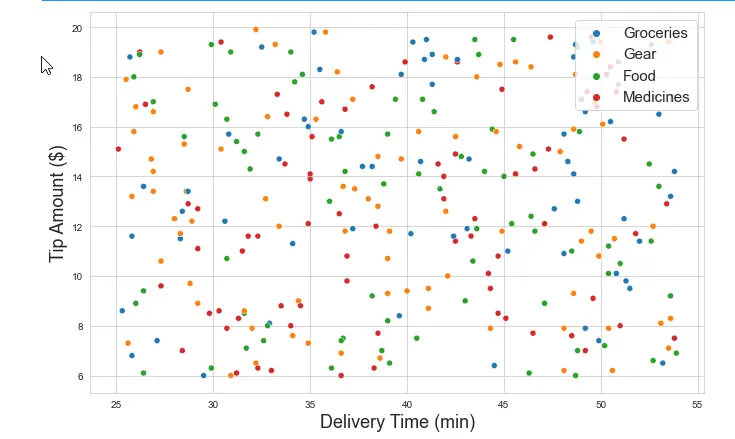
Resize scatter chart using figsize parameter
Let’s re-do this chart, this time, we’ll use the object oriented approach to create also a figure, that we can later resize.
fig, scatter = plt.subplots(figsize = (11,7))
scatter = sns.scatterplot(x = 'time_to_deliver', y ='del_tip_amount', data=deliveries, hue='type', )
scatter.set_xlabel('Delivery Time (min)', fontsize = 18)
scatter.set_ylabel ('Tip Amount ($)', fontsize = 18)
scatter.legend(loc='upper right', fontsize = 15);
Here’s the much nicer scatter chart in our Jupyter notebook (note i have tweaked the axes labels font size and the legend fonts and location).
Using rcParams
Instead of setting the size of your individual plots, you can simply use the runtime configuration of Matplotlib to set a common figsize value for all your notebooks charts. Here’s how to set it. Make sure that you have imported Matplotlib beforehahnd. Otherwise, you’ll get the name ‘plt’ is not defined error.
import matplotlib.pyplot as plt
plt.rcParams['figure.figsize'] = (11,7)
Changing Seaborn heatmap size
Using similar technique, you can also reset an heatmap
Here’s a simple snippet of the code you might want to use:
fig, heat = plt.subplots(figsize = (11,7))
heat = sns.heatmap(subset, annot=True, fmt= ',.2f' )
The above mentioned procedures work for other Seaborn charts such as line, barplots etc’.
Seaborn plot size not changing?
If setting your figsize correctly as per one of the methods above doesn’t do the tricvk, i would recommend that you save, close and re-open Jupyter Notebooks.
If you are just starting out with Data Visualization, you might also want to look into our tutorial on defining axis limits in Seaborn.